Learn Data Science Online with Free tutorials
Data Science Online Training is the art of uncovering the insights and trends in data.
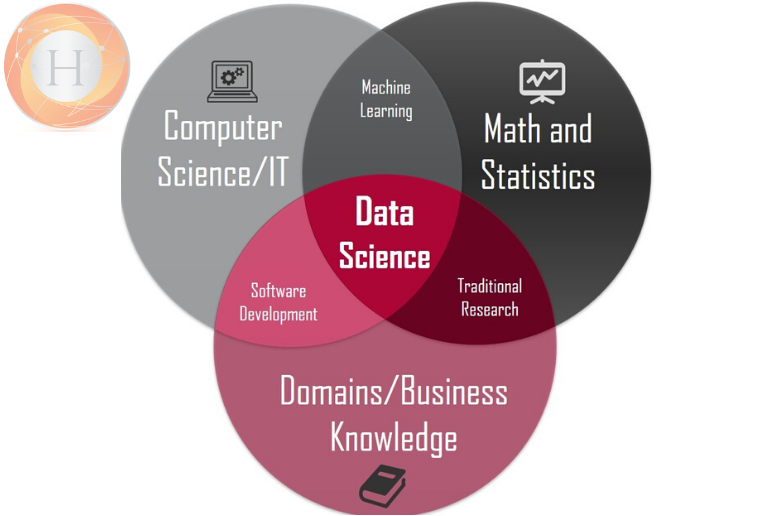
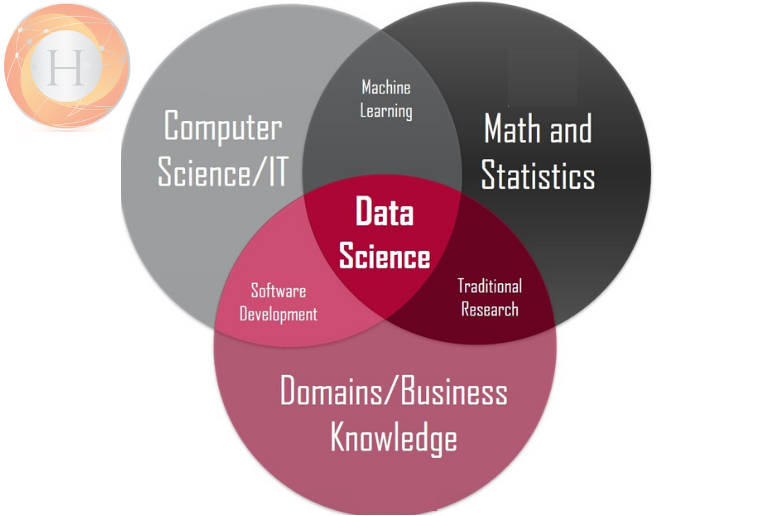
To Learn Data science online is an inter-disciplinary field that uses scientific methods, processes, algorithms and systems to extract knowledge and insights from many structured and unstructured data.
data science training
Who can Learn Data Science online?
In order to become a data scientist, one should have immense interest in the data and in identifying the hidden knowledge in the data. Interest and possession of basic knowledge in mathematics and statistical principles help understand and design new techniques. Coding is an essential requirement of a data scientist. Domain knowledge helps in understanding the problem at hand and paves the way for an optimized solution. Anyone who can cover these areas can attend data science bootcamp.
Advantages of Data Science Bootcamp
Data Science is greatly in demand.
Data Science offers abundance of Positions.
A Highly Paid Career.
Data Science is Versatile.
Data Science Makes Data Better.
Data Scientists are Highly Prestigious.
No More Boring Tasks only challenging and creative tasks.
Data Science Makes Products Smarter.
Data Science can Save Lives by providing insights into health care Data Science can make you better equip with.
What we should learn Data Science Online ?
Data science is an interdisciplinary field focused on extracting knowledge from data sets, which are typically large. The field encompasses analysis, preparing data for analysis, and presenting findings to inform high-level decisions in an organization. As such, it incorporates skills from computer science, mathematics, statistics, information visualization, graphic design, and business.
How will be the career in Data Science bootcamp and what next?
For three years in a row (2016-19), data science is named as the number 1 job in the US by Glassdoor
Over the last decade, there has been a huge explosion in the amount of data generated and retained by organizations. Almost every company or business today relies heavily on data, thus giving rise to a massive demand for qualified and experienced data scientists. And with more and more data being captured across the globe than ever before, the demand for expertise to extract valuable and actionable insights from that data is going to only grow by leaps and bounds.
DATA SCIENCE ONLINE TRAINING COURSE CONTENT
Learn Data Science Online Using R Language
- Data Science motivating examples — Money ball, okcupid, Nate Silver, Netfilx, LinkedIn,
- Introduction to Analytics, Types of Analytics,
- Introduction to Analytics Methodology
- Analytics Terminology, Analytics Tools
- Introduction to Big Data
- Introduction to Machine Learning
- What is Data Science?
- Common Terms in Analytics
- Types of problems and business objectives in various industries
- How leading companies are harnessing the power of analytics?
- Overview of analytics tools & their popularity
- List of steps in Analytics projects
- Identify the most appropriate solution design for the given problem statement
- Why R for data science?
- Introduction to R
- Install R & R studio
- Perform basic operations in R using command line
- Learn the use of IDE R Studio
- Use the ‘R help’ feature in R
- Variables in R
- Matrices
- List
- Scalars
- Vectors
- Data frames
- Using c, Cbind, Rbind, attach and detach functions in R
- Factors
- Data sorting
- Cleaning data
- Recoding data
- Merging data
- Slicing of Data
- Apply functions
- Topics
- Numerical functions
- Character functions
- Operators in R
- Arithmetic operator
- Relational operator
- Logical operator
- Assignment operator
- If loop
- For loop
- While loop
- Break, next and pass statement
- Reading Data from excel, csv and txt files
- Writing Data
- Basic SQL queries in R
- Connecting to the database
- Dealing with Date values
- Box plot
- Histogram
- Pareto charts
- Pie graph
- Line chart
- Scatterplot
- Developing Graphs
- Concept of model in analytics and how it is used?
- Common terminology used in analytics & modelling process
- Popular modelling algorithms
- Different Phases of Predictive Modelling
- Need for structured exploratory data
- EDA framework for exploring the data and identifying any problems with the data (Data Audit Report)
- Identify missing data
- Identify outliers data
- Visualize the data trends and patterns
- Introduction – Applications
- Assumptions of Linear Regression
- Building Linear Regression Model
- Understanding standard metrics (Variable significance, R-square/Adjusted R-square, Global hypothesis ,etc)
- Assess the overall effectiveness of the model
- Interpretation of Results
- Introduction – Applications
- Building Logistic Regression Model
- Understanding standard model metrics (Concordance, Variable significance, Hosmer Lemeshov Test, Gini, KS, Misclassification, ROC Curve etc)
- Validation of Logistic Regression Models
- Standard Business Outputs (ROC Curve, Probability Cut-offs, Lift charts, Model equation, Drivers or variable importance, etc)
- Decision Trees – Introduction – Applications
- Types of Decision Tree Algorithms
- Construction of Decision Trees through Simplified Examples; Choosing the “Best” attribute at each Non-Leaf node; Entropy; Information Gain, Gini Index, Chi Square, Regression Trees
- Generalizing Decision Trees; Information Content and Gain Ratio; Dealing with Numerical Variables; other Measures of Randomness
- Pruning a Decision Tree; Cost as a consideration
- Decision Trees – Validation
- Overfitting – Best Practices to avoid
- Concept of Ensembling
- Random forest (Logic, Practical Applications)
- SUPERVISED LEARNING: SUPPORT VECTOR MACHINES
- Motivation for Support Vector Machine & Applications
- Interpretation of Outputs and Fine tune the models with hyper parameters
- What is KNN & Applications?
- KNN for missing treatment
- KNN For solving regression problems
- KNN for solving classification problems
- Validating KNN model
- Model fine tuning with hyper parameters
- Concept of Conditional Probability
- Bayes Theorem and Its Applications
- Naïve Bayes for classification
- Applications of Naïve Bayes in Classifications
- TIME SERIES FORECASTING: SOLVING FORECASTING PROBLEMS
- Introduction – Applications
- Basic Techniques – Averages, Smoothening, etc
- Advanced Techniques – AR Models, ARIMA, etc
- Understanding Forecasting Accuracy – MAPE, MAD, MSE, etc
- What is segmentation & Role of ML in Segmentation?
- K-Means Clustering
- Expectation Maximization
Learn Data Science Online Using Python
- What is Data Science?
- Common Terms in Analytics
- Types of problems and business objectives in various industries
- Overview of analytics tools & their popularity
- List of steps in Analytics projects
- Identify the most appropriate solution design for the given problem statement
- Why Python for data science?
- Overview of Python- Starting with Python
- Introduction to installation of Python
- Introduction to Python IDE’s
- Understand Jupyter notebook
- Concept of Packages/Libraries – Important packages(NumPy, SciPy, scikit-learn, Pandas, Matplotlib, etc)
- Installing & loading Packages & Name Spaces
- Data Types & Data objects/structures (strings, Tuples, Lists, Dictionaries)
- List and Dictionary Comprehensions
- Basic Operations
- Reading and writing data
- Simple plotting
- Control flow & conditional statements
- How to create class and modules and how to call them?
- Numpy, pandas, matplotlib, scikitlearn etc
- ACCESSING/IMPORTING AND EXPORTING DATA USING PYTHON MODULES
- Importing Data from various sources (Csv, txt, excel etc)
- Viewing Data objects – subsetting, methods
- Exporting Data to various formats
- Important python modules: Pandas
- Cleansing Data with Python
- Data Manipulation steps(Sorting, filtering, duplicates, merging, appending, subsetting, derived variables, sampling, Data type conversions, renaming, formatting etc)
- Data manipulation tools(Operators, Functions, Packages, control structures, Loops, arrays etc)
- Normalizing data
- Formatting data
- Important Python modules for data manipulation (Pandas, Numpy, re, math, string, datetime etc)
- Introduction exploratory data analysis
- Descriptive statistics, Frequency Tables and summarization
- Univariate Analysis (Distribution of data & Graphical Analysis)
- Bivariate Analysis(Cross Tabs, Distributions & Relationships, Graphical Analysis)
- Creating Graphs- Bar/pie/line chart/histogram/ boxplot/ scatter/ density etc)
- Important Packages for Exploratory Analysis(NumPy Arrays, Matplotlib, Pandas etc)
- Basic Statistics – Measures of Central Tendencies and Variance
- Building blocks – Probability Distributions – Central Limit Theorem
- Inferential Statistics -Sampling – Concept of Hypothesis Testing
- Statistical Methods – Z/t-tests( One sample, independent, paired), Anova, Correlations and Chi-square
- Important modules for statistical methods: Numpy, Scipy, Pandas
- Principle component Analysis (PCA)
DATA SCIENCE ONLINE TRAINING WITH FREE TUTORIAL
DATA SCIENCE BOOTCAMP VIDEO
coming soon !!!
DATA SCIENCE BOOTCAMP INSTRUCTOR

Raghunath
Close to 2 decades of experience in academia and IT industry. Served technology giant Satyam Computers in a senior position and led huge training and IT services projects. Initiated 3 startups successfully. Recent startup was was a digital auditing app in retail, space widely used by retail organizations. The startup was acquired recently. Worked as a Resource Person for various academic institutions. Currently Imparting Training on machine learning and Data Science thru R and Python. And currently, on the board of 2 startup initiatives as strategic advisor for their technology implementation.
Working in the HR domain for Data Analytics
REVIEW
[wp-review]
COMMENTS
BLOG

How to start a career in Blockchain
Blockchain is a distributed ledger that is supporting bitcoin, as it is finding its way into an increasing number of domains. We are here to give an intro to this exciting new technology along with tips on how to get started in a blockchain development career. Along with technology trends like AI and Artificial Intelligence
How CRM Is Being Used All Over And Why You Have To Learn It?
Most of the brands currently are depending on personal relationships that will be turning leads into customers thus helping you to deliver a great customer experience. If you are a part of budding businesses, that personalization process has to often be relied upon gathering the customer data from various third-party sources and that era too
Why Should You Get Into Learning Big Data And Hadoop
The world is getting increasingly digital and Big Data is here to stay and the importance of Big Data and corresponding Big Data analytics is going to continue growing in the coming years. Big Data and Hadoop skill are here to stay and it will be more meaningful if there is a difference between having
Recent Comments